
So far, it has not been easy to get an understanding of how much Simple Poll is used across your workspace. You could maybe do a search for polls using Slack, or if you dug really deep into the Simple Poll dashboard you could find an actual number or two. But these options weren't very good and didn't carry much insight.
We're excited to announce that as of this week, the Simple Poll dashboard has a brand new Usage page, which any member of your workspace can visit to see how much Simple Poll has been in use.
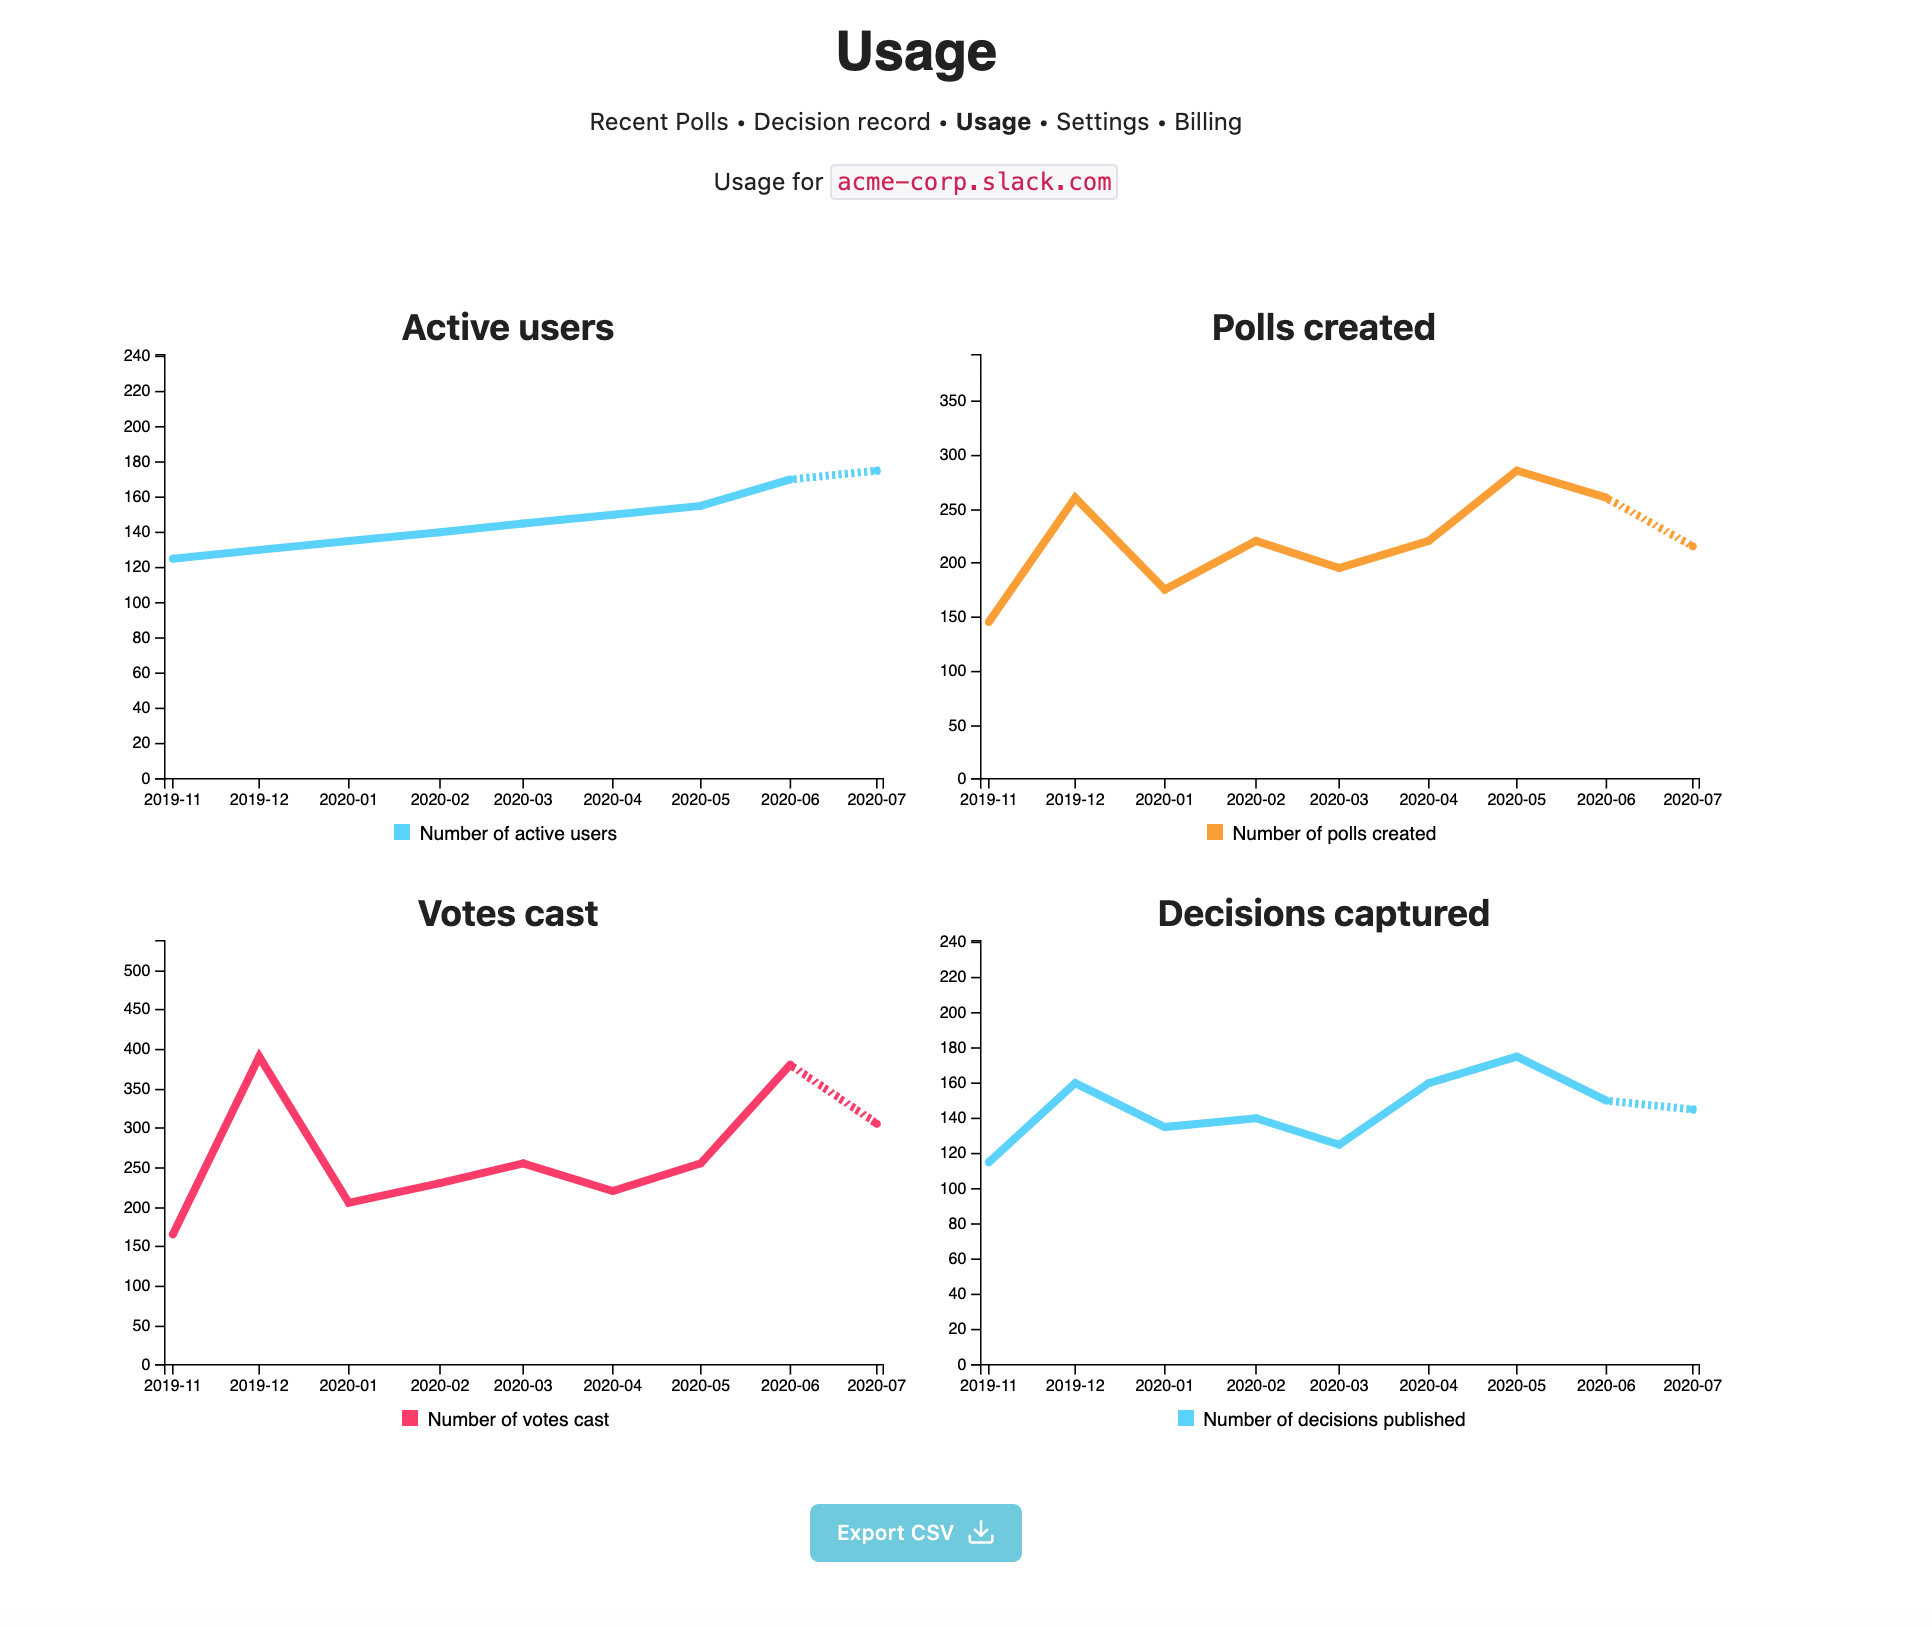
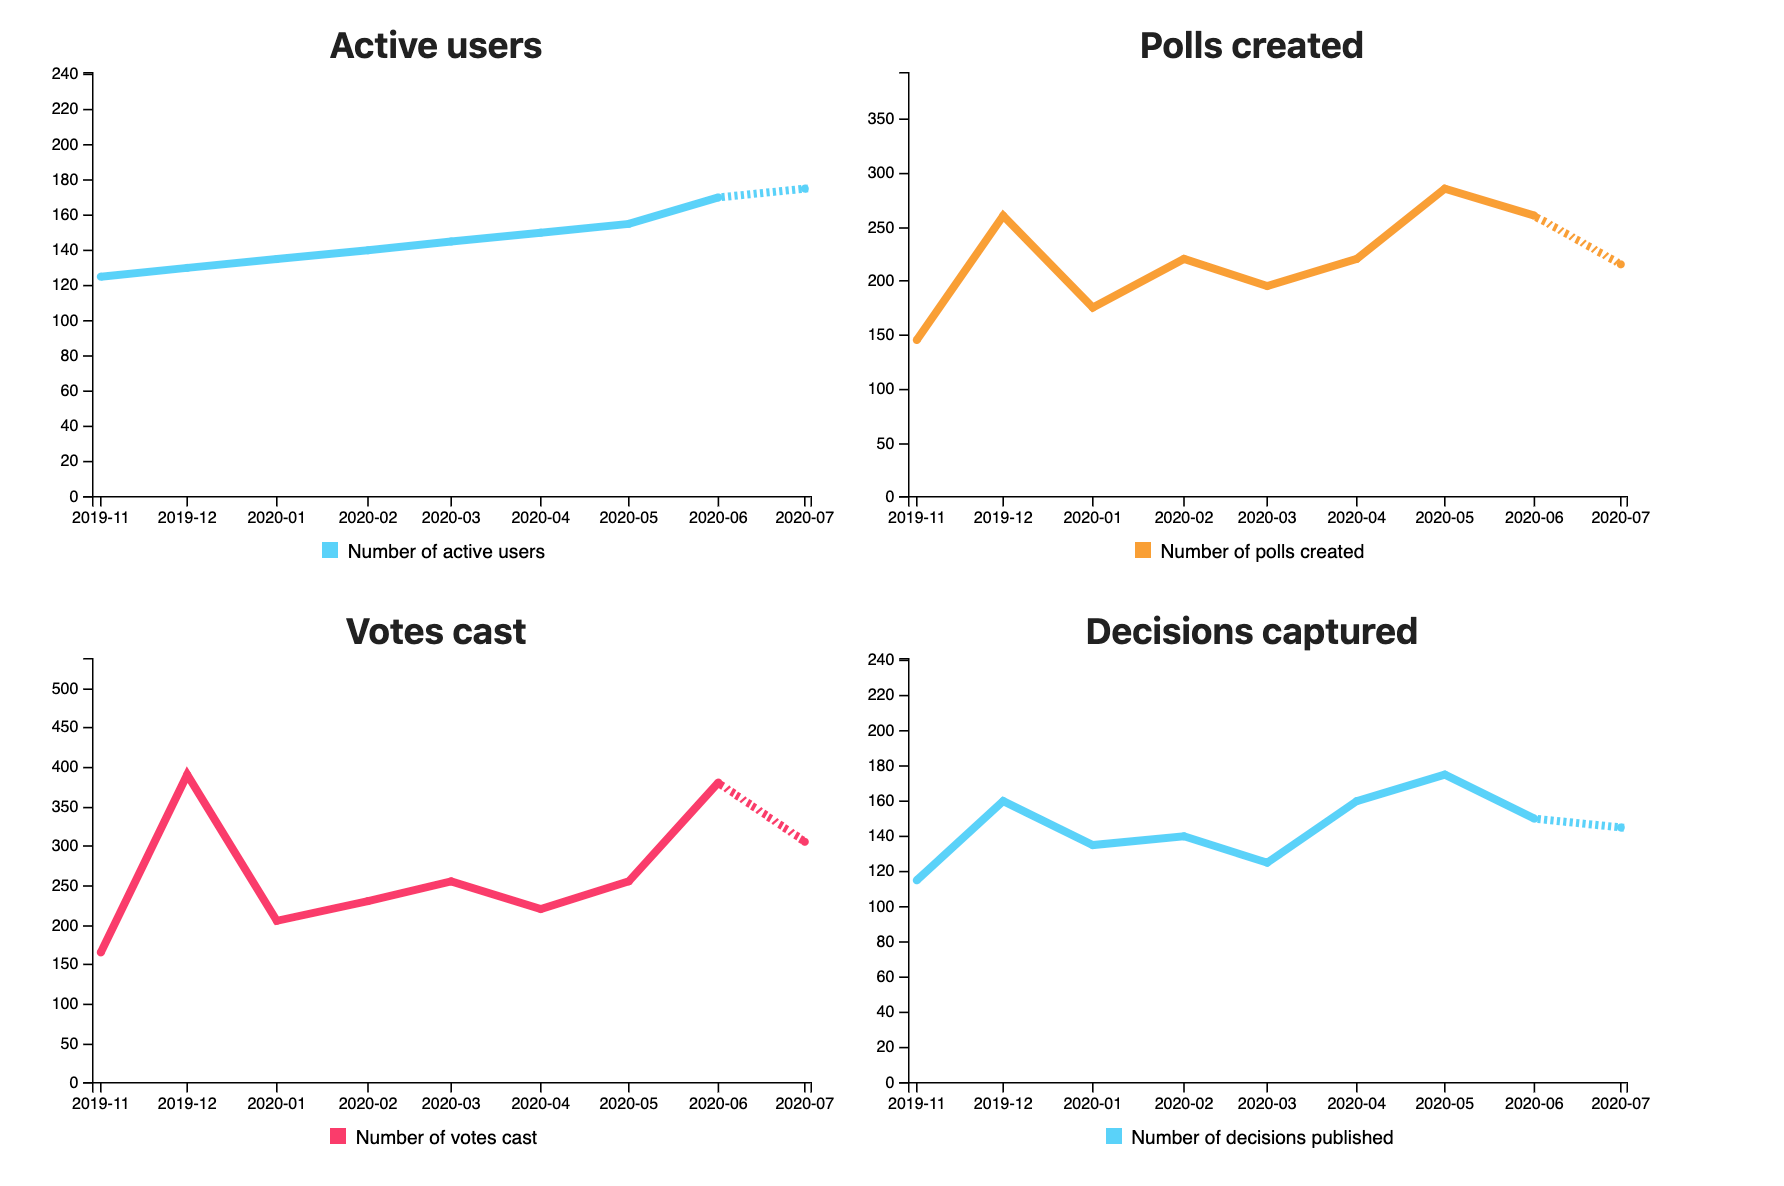
You'll see four charts:
- Polls created
- Votes cast
- Active users
- Decisions captured
Each chart is broken down by month, so you can see how your workspace's usage developed over time. You can also download a CSV file of the usage data, in case you'd like to inspect the data more closely 📈
Navigate to the Usage page via the Simple Poll dashboard or directly with this link: https://simplepoll.rocks/my/dashboard/usage/
Enterprise
Customers using Simple Poll Enterprise will be able to see the same usage data grouped by month, by workspace, and also total usage for all workspace within their enterprise grid instances.
If you would like to upgrade to Simple Poll Enterprise, please get in touch.